For years, the rack was the boring part of IT. Budgets went to cloud, software and security tools, while the cabinet in the basement just had to work. If a cable looked messy, nobody cared as long as the lights stayed green.
That’s changing fast. Your physical IT infrastructure now carries more load and more regulatory weight than it did 5 years ago. Treat it as an afterthought and it’ll cost you, mostly in hours you never planned to spend.
At a glance
- Rack density keeps climbing: the most common rack now draws 11 kW.
- NIS2 makes top management accountable for cybersecurity in 18 critical sectors.
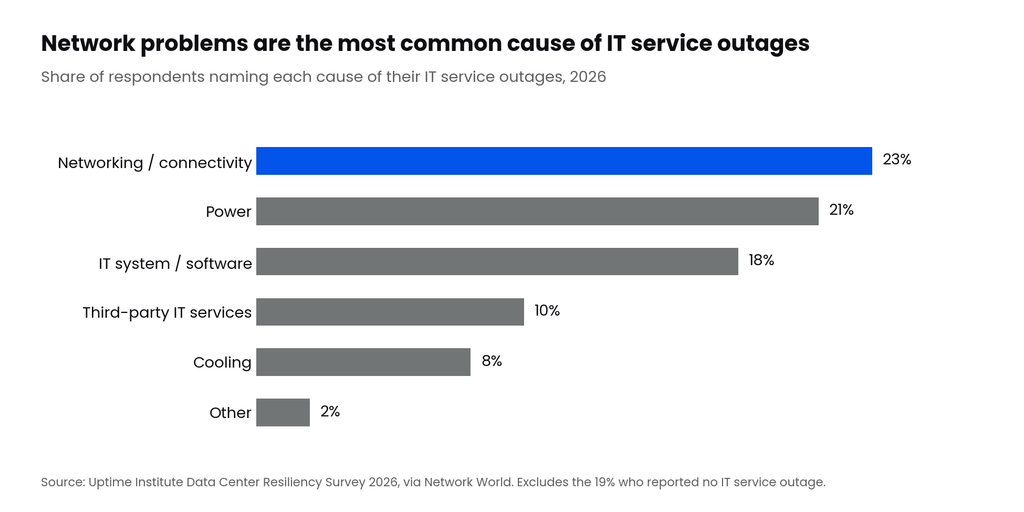
- Network problems are the most common cause of IT service outages.
- Most efficiency gets lost in small moments: tracing cables, wasted rack units and outdated documentation.
What changed
Start with density. In Uptime Institute’s 2026 Global Data Center Survey, the most common rack density reached 11 kW, up from 9 kW a year earlier. More power per rack means more heat in the same 19″ space, and far less tolerance for cables that block airflow.
Then there’s regulation. NIS2 covers 18 critical sectors across the EU and makes top management accountable for cybersecurity risk management. If your company falls under it, a rack that nobody can explain is hard to defend in an audit.
The outage data points the same way. In Uptime’s 2026 resiliency survey, networking and connectivity problems were the most common cause of IT service outages, at 23%. On top of that, 53% of operators struggle to find qualified staff. When the one person who knows the rack leaves, the knowledge leaves with them.
Where efficiency gets lost in the physical layer
Most of the waste never shows up on a spreadsheet. It hides in small moments:
- A simple port change takes 2 minutes in a tidy rack. In a messy one, you spend 20 minutes tracing a cable and 10 more untangling its neighbours.
- Horizontal cable managers eat rack units that could hold active gear.
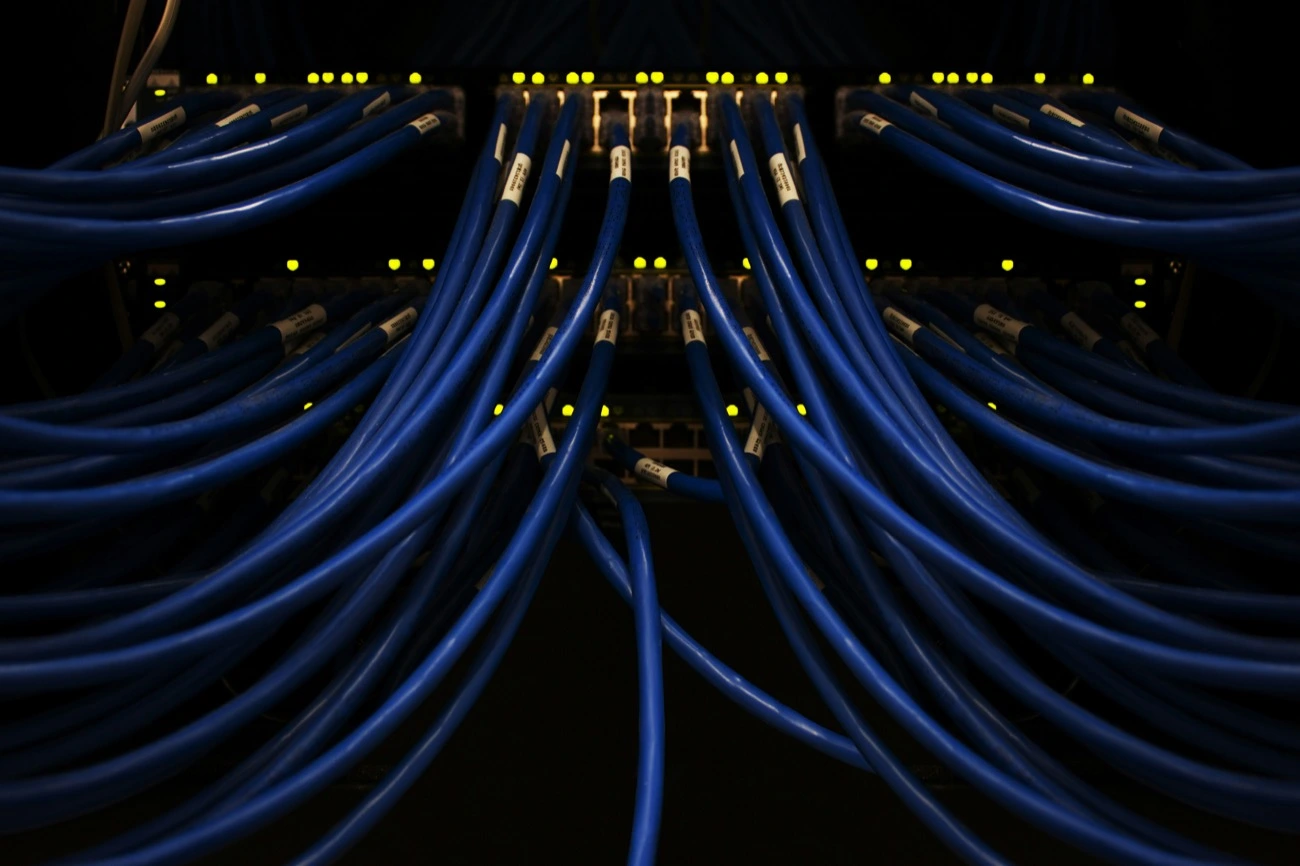
- Long patch cords pile up as slack in front of the switch, where they block airflow and hide the port labels you need.
- Documentation goes stale, because nobody updates the spreadsheet after a quick fix at 2 AM.
Multiply that by every move, add and change in a year and you’ve lost whole weeks.
A spreadsheet last touched in 2021 isn’t documentation. It’s a guess with a date on it.
What efficient physical infrastructure looks like
You don’t need a new data center. You need a rack that explains itself.
In practice, an efficient rack passes this checklist:
- Every patch cord has the length it needs, with no coiled slack
- Cable management doesn’t take rack units away from active gear
- Both ends of every cable are labelled
- Every port is documented somewhere other than one person’s head
- The layout is standardised, so other sites can copy it
That’s what we build at Patchbox. With patchbox.one, every patch cord sits in its own cassette and retracts when you don’t need the extra length. The Patchcatch guides cables as 0RU cable management, so it doesn’t take up a single rack unit. For documentation, Patchdocs maps Layer 1: the cables, patch panels and ports that no IPAM or CMDB tracks.
Standardisation multiplies the effect. Once one rack follows a clear pattern, every other site can copy it, the way a sporting goods retailer did across more than 1,700 stores. If NIS2 is on your list, our NIS2 report covers the physical side in more detail.